

As you may know, the biggest impact to value in Mining Projects are elements such as:
Grade, commodity price, processing throughput, capital and processing and mining unit costs to name a few, generally being less sensitive to capital fluctuations due to the large scale nature of the industry.
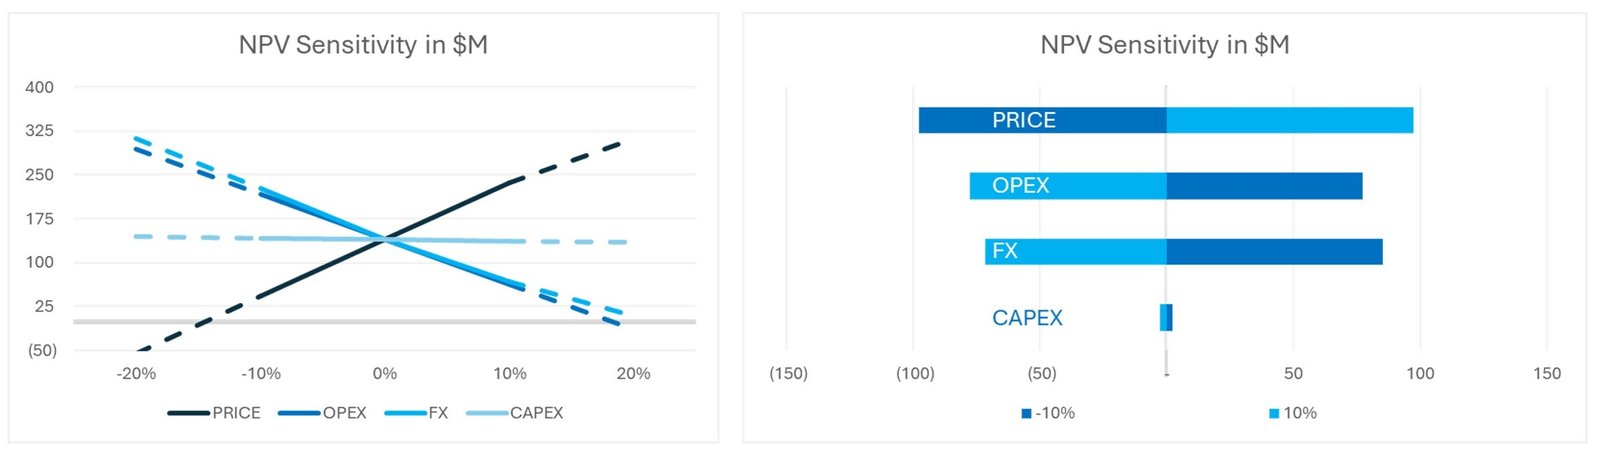
[Chart displaying sensitivity trends to overall resulting NPV and direct NPV impact ratio]
A sensitivity assessment illustrates the impact of the key value drivers of a mining project, in terms of NPV variability derived from individual changes of such elements. The value for a sensitivity assessment comes from displaying the ratio of impact of such key value drives, be it a parameter within control or not. In most cases, the variability is applied equally for simplification purposes to understand how robust the projects financial metrics in relation to minimum requirements for return of investment.
However, to understand adequately the projects exposure to an unfavourable economic outcome due to these parameters being less than assumed, a risk assessment is required by including the likelihood of occurrence (probability).
This approach accounts for classic challenges such as parameters with historically negative correlation, such as exchange rate and high commodity prices.
The risk of grade on a mining project should account for likelihood for higher grade and lower grade, being potentially not equal.
The recommended approach is to prove the projects robustness combining all the key metrics tested in the sensitivity analysis where each of the parameters would have a distinct distribution and probability of occurrence. However, most Project Managers are not familiar with such approach or under what conditions the project is considered successful.

P80 NPV > 0 (or other financial KPI) is usually accepted practice, where grade is dependent on the mineral resource estimate (MRE) classification and the spatial distribution of quality; price and exchange rate are statistical distributions based on benchmarked forecast; CAPEX, OPEX and schedule are commonly either a PERT or Inverse Gaussian distribution based on similar projects with historical recorded financial performance.
A risk analysis can be completed, by either combining all variables and prove projects overall likelihood of achieving desired outcomes and/or testing impact of each variable based on their likelihood of not delivering expected performance and therefore quantifying the variable inherent risk.
This sort of analysis enables in some cases justify elements such as:
i. Where further studies should be focused
ii. Where mitigating actions or controls should be implemented
iii. Where project specific metrics should be implemented
Should the risk be outside of the business threshold or enable implementation of controls to try and mitigate once project is either in construction or operational. The analysis above does necessary included the unknown-unknows, also referred to as unk-unk’s, but that is for another day.

Shaping Earth, Crafting Futures, The Essence of Our Mining Identity. Get A Free Estimate!